Free Facebook Likes, Youtube Subscribers,  Twitter Followers

Ads 468x60px

Blogger Tricks

Blogger Themes

28. 6. 2012.

Respiratory responses to acute exercise

Pulmonary ventilation during dynamic exercise

The onset of exercise is accompanied by an immediate increase in ventilation. In fact, like the HR response, the marked increase in breathing may occur even before the onset of muscular contractions. This is shown in the picture below for light, moderate and heavy exercise. Because of its rapid onset, this initial respiratory adjustment to the demands of exercise is undoubtedly neural in nature, mediated by respiratory control centers in the brain(central command), although neural input can also come from receptors in the exercising muscle.
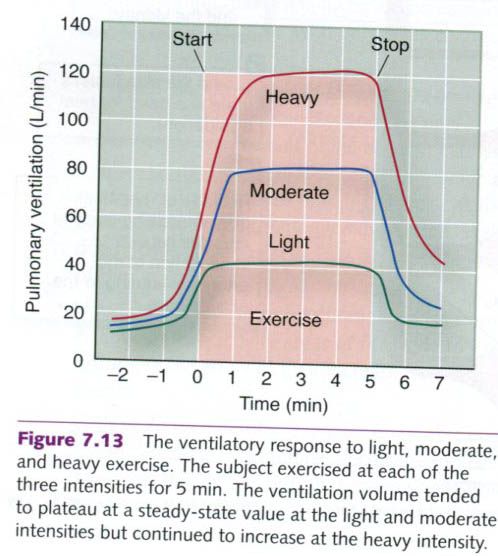


The more gradual second phase of the respiratory increase shown in the picture is controlled primarily by changes in the chemical status of the arterial blood. As exercise progresses, increased metabolism in the muscles generates more carbon dioxide and H+. Recall that these changes enhance oxygen unloading in the muscles, which increases the (a-ṽ)O2 difference.  Increased CO2 and H+ are sensed by chemoreceptors primarily located in the brain, carotid bodies, and lungs, which in turn stimulate the inspiratory center, increasing rate and depth of respiration. Some researchers have suggested that chemoreceptors in the muscles might also be involved. In addition, data suggest that receptors in the right ventricle of the heart send information to the inspiratory center so that increases in cardiac output can stimulate breathing during the early minutes of exercise. These humoral influences on breathing rate and pattern serve to fine-tune the respiratory response to exercise so as to match oxygen delivery with aerobic demands without overtaxing respiratory muscles.
At the end of exercise, the muscles’ energy demands decrease almost immediately to resting levels. But pulmonary ventilation returns to normal at a slower rate. If the rate of breathing perfectly matched the metabolic demands of the tissues, respiration would decrease to the resting level within seconds after exercise. But respiratory recovery takes several minutes, which suggests that postexercise breathing is regulated primarily by acid-base balance, the partial pressure of dissolved carbon dioxide(PCO2), and blood temperature.

Breathing irregularities during exercise

Ideally, breathing during exercise is regulated in a way that maximizes aerobic performance. However, respiratory dysfunction during exercise can hinder performance.

Dyspnea

The sensation of dyspnea(shortness of breath) during exercise is common among individuals in poor physical condition who attempt to exercise at levels that significantly elevate arterial carbon dioxide and H+ concentrations. Both stimuli send strong signals to the inspiratory center to increase the rate and depth of ventilation. Although exercise – induced dyspnea is sensed as an inability to breathe, the underlying cause is an inability to adjust breathing to blood PCO2 and H+.
Failure to reduce these stimuli during exercise appears to be related to poor conditioning of respiratory muscles. Despite a strong neural drive to ventilate the lungs, the respiratory muscles fatique easily and are unable to reestablish normal homeostasis.

Hyperventilation

The anticipation of or anxiety about exercise, as well as some respiratory disorders, can cause an increase in ventilation in excess of that needed for exercise metabolism. Such overbreathing is termed hyperventilation. At rest, hyperventilation can decrease the normal PCO2 of 40mmHg in the alveoli and arterial blood to about 15mmHg. As arterial carbon dioxide concentrations decrease, blood pH increases. These effects combine to reduce the ventilatory drive. Because the blood leaving the lungs is nearly always about 98% saturated with oxygen, an increase in the alveolar PO2 does not increase the oxygen content of the blood. Consequently, the reduced drive to breathe – along with the improved ability to hold one’s breath after hyperventilating – results from carbon dioxide unloading rather than increased blood oxygen. Even when performed for only a few seconds, such deep, rapid breathing can lead to light-headedness and even loss of consciousness. This phenomenon reveals the sensitivity of the respiratory system’s regulation of carbon dioxide and pH.

Valsalva maneuver

The Valsalva maneuver is a potentially dangerous respiratory procedure that frequently accompanies certain types of exercise, in particular the lifting of heavy objects. This occurs when the individual:
  • Closes the glottis(the opening between the vocal cords);
  • Increases the intra-abdominal pressure by forcibly contracting the diaphragm and the abdominal muscles,
  • Increases the intrathoracic pressure by forcibly contracting the respiratory muscles.

As a result of these actions, air is trapped and pressurized in the lungs. The high intra-abdominal and intra-thoracic pressures restrict venous return by collapsing the great veins. This maneuver, if held for an extended period of time, can greatly reduce the volume of blood returning to the heart, decreasing cardiac output and altering arterial blood pressure.  Although the Valsalva maneuver can be helpful in certain circumstances, this maneuver can be dangerous and should be avoided.

Ventilation and energy metabolism

During long periods of mild steady-state activity, ventilation matches the rate of energy metabolism, varying in proportion to the volume of oxygen consumed and the volume of carbon dioxide produced(VO2 and VCO2 respectively) by the body.

Ventilatory equivalent for oxygen

The ratio between the volume of air expired or ventilated(Ve) and the amount of oxygen consumed by the tissues(VO2) in a given amount of time is referred to as the ventilatory equivalent for oxygen, or Ve/VO2. It is typically measured in liters of air breathed per liter of oxygen consumed per minute.
At rest, the Ve/VO2 can range from 23 to 28L of air per liter of oxygen. This value changes very little during mild exercise, such as walking. But when exercise intensity increases to near-maximal levels, the Ve/VO2 can be greater than 30L of air per liter of oxygen consumed. In general, however, the Ve/VO2 remains relatively constant over a wide range of exercise intensities, indicating that the control of breathing is properly matched to the body’s demand of oxygen.

Ventilatory threshold

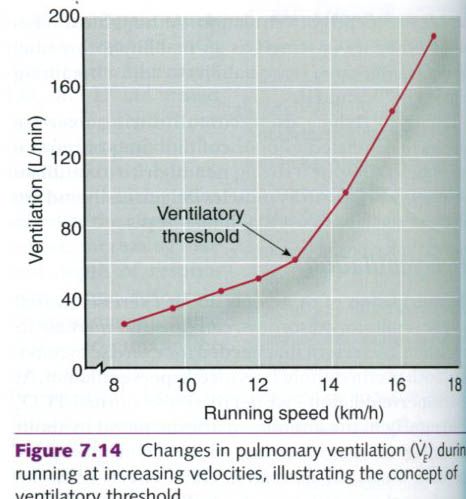
As exercise intensity increases, at some point ventilation increases disproportionately to oxygen consumption. The point at which this occurs is called the ventilatory threshold, illustrated in the figure below. When work rate exceeds ~55% to 70% of VO2max, at approximately the same point as the ventilatory threshold, more lactate starts to appear in the blood. This may result from greater production of lactate or less clearance of lactate. This lactic acid combines with sodium bicarbonate(which buffers acid) and forms sodium lactate, water, and carbon dioxide. As it is known, the increase in carbon dioxide stimulates chemoreceptors that signal the inspiratory center to increase ventilation. Thus, the ventilatory threshold reflects the respiratory response to increased carbon dioxide levels. Ventilation increases dramatically beyond the ventilatory threshold.


Respiratory limitations to performance

Like all tissue activity, respiration requires energy. Most of this energy is used by the respiratory muscles during pulmonary ventilation. At rest, the respiratory muscles account for only about 2% of the total oxygen uptake. As the rate and depth of ventilation increase, so does the energy cost of respiration. The diaphragm, the intercostal muscles, and the abdominal muscles can account for up 11% of the total oxygen consumed during heavy exercise and can receive up to 15% of the cardiac output. During recovery from dynamic exercise, sustained elevations in ventilation continue to demand increased energy, accounting for 9% to 12% of the total oxygen consumed postexercise.
Although the muscles of respiration are heavily taxed during exercise, ventilation is sufficient to prevent an increase in alveolar PCO2 or a decline in alveolar PO2 during activities lasting only a few minutes. Even during maximal effort, ventilation usually is not pushed to its maximal capacity to voluntarily move air in and out of the lungs. This capacity is called the maximal voluntary ventilation and is significantly greater than ventilation at maximal exercise. However, considerable evidence suggests that pulmonary ventilation might be a limiting factor during very high intensity(95~100% VO2max) exercise in highly trained subjects.
Can heavy breathing for several hours(such as during marathon running) cause glycogen depletion and fatique of the respiratory muscles? Animal studies have shown a substantial sparing of their respiratory muscle glycogen compared with muscle glycogen in exercising muscles. Although similar data are not available for humans, our respiratory muscles are better designed for long-term activity than are the muscles in our extremities. The diaphragm, for example, has two to three times more oxidative capacity(oxidative enzymes and mitochondria) and capillary density than other skeletal muscle. Consequently, the diaphragm can obtain more energy from oxidative sources than can skeletal muscles.
Similarly, airway resistance and gas diffusion in the lungs do not limit exercise in a normal, healthy individual. The volume of air inspired can increase 20- to 40-fold with exercise – from ~5L/min at rest up to 100 to 200 L/min with maximal exertion. Airway resistance, however, is maintained at near-resting levels by airway dilation(through an increase in the laryngeal aperture and bronchodilation). During submaximal and maximal efforts in untrained and moderately trained individuals, blood leaving the lungs remains nearly saturated with oxygen(~98%). However, with maximal exercise in some highly trained elite endurance athletes, there is too large a demand on lung gas exchange, resulting in a decline in arterial PO2 and arterial oxygen saturation(i.e. exercise-induced arterial hypoxemia, EIAH). Approximately 40% to 50% of elite endurance athletes experience a significant reduction in arterial oxygenation during exercise approaching exhaustion. Arterial hypoxemia at maximal exercise is likely the result of a mismatch between ventilation and perfusion of the lung. Since cardiac output is extremely high in elite athletes, blood is flowing through the lungs at a high rate and thus there may not be sufficient time for that blood to become saturated with oxygen. Thus, in healthy individuals, the respiratory system is well designed to accommodate the demands of heavy breathing during short- and long-term physical effort. However, some highly trained individuals who consume unusually large amounts of oxygen during exhaustive exercise can face respiratory limitations.
The respiratory system also can limit performance in patient populations with restricted or obstructed airways. For example, asthma causes constrtiction of the bronchial tubes and swelling of the mucous membranes. These effects cause considerable resistance to ventilation, resulting in a shortness of breath. Exercise is known to bring about symptoms of asthma, or to worsen those symptoms in select individuals. The mechanism or mechanisms through which exercise induces airway obstruction in individuals with so-called exercise-induced asthma remain unknown, despite extensive study.

Respiratory regulation of acid-base balance

As already noted, high-intensity exercise results in the production and accumulation of lactate and H+. Although regulation of acid-base balance involves more than control or respiration, it is discussed here because the respiratory system plays such a crucial role in rapid adjustment of the body’s acid-base status during and immediately after exercise.
Acids, such as lactic acid and carbonic acid, release H+. The metabolism of carbohydrate, fat, or protein produces inorganic acids that dissociate, increasing the H+ concentration in body fluids, thus lowering the pH. To minimize the effects of free H+, the blood and muscles contain base substances that combine with, and thus buffer or neutralize, the H+:

H+ + buffer ---> H-buffer

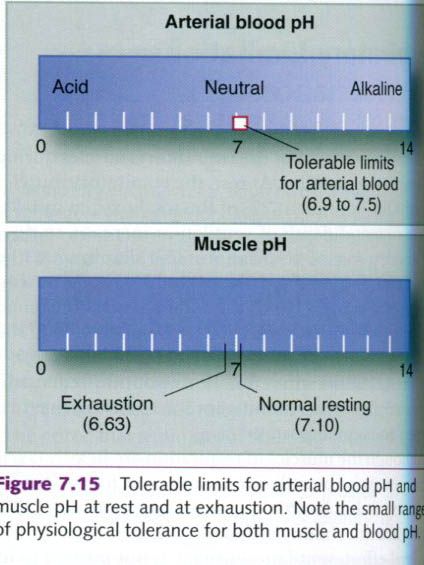
Under resting conditions, body fluids have more bases(such as bicarbonate, phosphate, and proteins) than acids, resulting in a slightly alkaline tissue pH that ranges from 7.1 in muscle to 7.4 in arterial blood. The tolerable limits for arterial blood pH extend from 6.9 to 7.5, although the extremes of this range can be tolerated only for a few minutes(see figure below). An H+ concentration above normal(low pH) is referred to as acidosis, whereas a decrease in H+ below the normal concentration(high pH) is termed alkalosis.
The pH of intra- and extracellular body fluids is kept within a relatively narrow range by:
  • Chemical buffers in the blood,
  • Pulmonary ventilation,
  • Kidney function.


The three major chemical buffers in the body are bicarbonate(HCO3-), inorganic phosphates(P), and proteins. In addition to these, hemoglobin in the red blood cells is also a major buffer. Table below illustrates the relative contributions of these buffers in handling acids in the blood. Recall that bicarbonate combines with H+ to form carbonic acid, thereby eliminating the acidifying influence of free H+. The carbonic acid in turn forms carbon dioxide and water in the lungs. The CO2 is then exhaled and only water remains.

Buffering capacity of blood components
Buffer
Slykes
%
Bicarbonate
18.0
64
Hemoglobin
8.0
29
Proteins
1.7
6
Phosphates
0.3
1
Total
28.0
100

The amount of bicarbonate that combines with H+ equals the amount of acid buffered. When lactic acid decreases the pH from 7.4 to 7.0, more than 60% of the bicarbonate initially present in the blood has been used. Even under resting conditions, the acid produced by the end products of metabolism would use up a major portion of the bicarbonate from the blood if there were no other way of removing H+ from the body. Blood and chemical buffers are required only to transport metabolic acids from their sites of production(the muscles) to the lungs or kidneys, where they can be removed. Once H+ is transported and removed, the buffer molecules can be reused.
In the muscle fibers and the kidney tubules. H+ is primarily buffered by phosphates, such as phosphoric acid and sodium phosphate. Less is known about the capacity of the buffers intracellularly, although cells contain more protein and phosphates and less bicarbonate than do the extracellular fluids.
As noted earlier, any increase in free H+ in the blood stimulates the respiratory center to increase ventilation. This facilitates the binding of H+ to bicarbonate and removal of carbon dioxide. The end result is a decrease in free H+ and in increase in blood pH. Thus, both the chemical buffers and the respiratory system provide short-term means of neutralizing the acute effects of exercise acidosis. To maintain a constant buffer reserve, the accumulated H+ is removed from the body via excretion by the kidneys and eliminated in urine. The kidneys filter H+ from the blood along with other waste products. This provides a way to eliminate H+ from the body while maintaining the concentration of extracellular bicarbonate.
During sprint exercise, muscle glycolysis generates a large amount of lactate and H+, which lowers the muscle pH from a resting level of 7.1 to less than 6.7. As shown in the table below, an all-out 400m sprint decreases leg muscle pH to 6.63 and increases muscle lactate from a resting value of 1.2 mmol/kg to almost 20 mmol/kg of muscle. Such disturbances in acid-base balance can impair muscle contractility and its capacity to generate adenosine triphosphate(ATP). Lactate and H+ accumulate in the muscle, in part because they do not freely diffuse across the skeletal muscle fiber membranes. Despite the great production of lactate and H+ during  the nearly 60s required to run 400m, these by-products diffuse throughout the body fluids and reach equilibrium after only about 5 to 10 min of recovery. Five minutes after the exercise, the runners described in the table below had blood pH values of 7.10 and blood lactate concentrations of 12.3 mmol/L, compared with a resting pH of 7.40 and a resting lactate level of 1.5 mmol/L.

Blood and muscle pH and lactate concentration 5 minutes after a 400m run


Muscle
Blood
Runner
Time(s)
pH
Lactate(mmol/kg)
pH
Lactate(mmol/kg)
1
61.0
6.68
19.7
7.12
12.6
2
57.1
6.59
20.5
7.14
13.4
3
65.0
6.59
20.2
7.02
13.1
4
58.5
6.68
18.2
7.10
10.1
Average
60.4
6.64
19.7
7.10
12.3

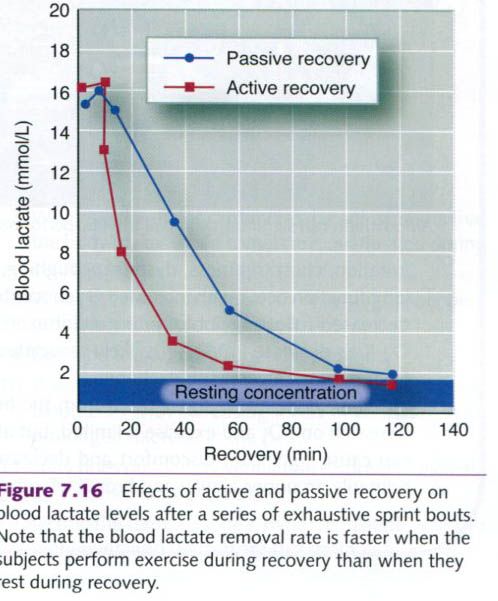
Reestablishing normal resting concentrations of blood and muscle lactate after such an exhaustive exercise bout is a relatively slow process, often requiring 1 to 2h. As shown in the figure below, recovery of blood lactate to the resting level is facilitated by continued lower-intensity exercise, called active recovery. After a series of exhaustive sprint bouts, the participants in this study either sat quietly(passive recovery) or exercised at an intensity of 50% of VO2max. Blood lactate is removed more quickly during active recovery because the activity maintains elevated blood flow through the active muscles, which in turn enhances both lactate diffusion out of the muscles and lactate oxidation.
Although blood lactate remains elevated for 1 to 2h after highly anaerobic exercise, blood and muscle H+ concentrations return to normal within 30 to 40 min of recovery. Chemical buffering, principally by bicarbonate, and respiratory removal of excess carbon dioxide are responsible for this relatively rapid return to normal acid-base balance.

26. 6. 2012.

Cardiovascular responses to acute exercise - part III


Blood flow

Acute changes in cardiac output and blood pressure during exercise allow for increased total blood flow to the body. These responses facilitate getting blood to areas where it is needed, primarily the exercising muscles. Additionally, sympathetic control of the cardiovascular system can redistribute blood so that areas with the greatest metabolic need receive more blood than areas with low demands.

Redistribution of blood during exercise

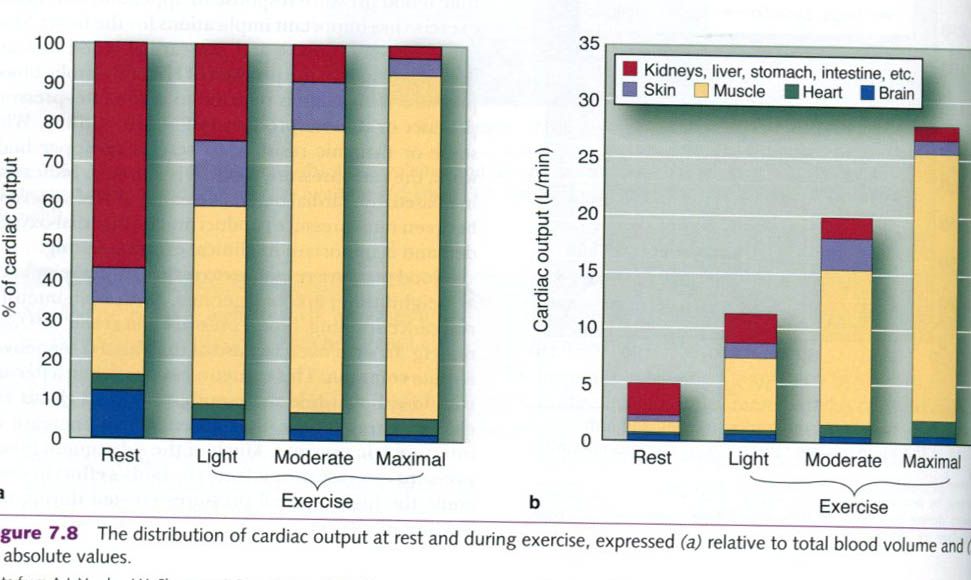
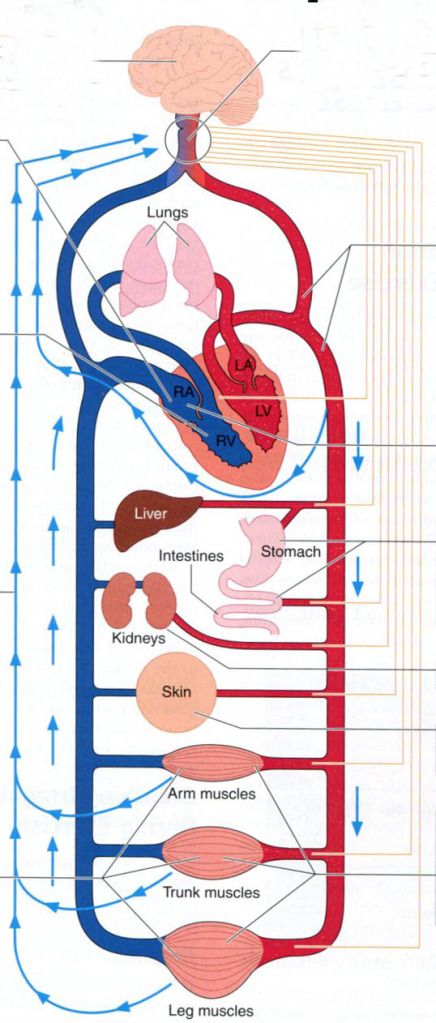
Blood flow patterns change markedly in the transition from rest to exercise. Through the action of the sympathetic nervous system, blood is redirected away from areas where elevated flow is not essential to those areas that are active during exercise. Only 15% to 20% of the resting cardiac output goes to muscle, but during high-intensity exercise, the muscles may receive 80% to 85% of the cardiac output. This shift in blood flow to the muscles is accomplished primarily by reducing blood flow to the kidneys and the primarily by reducing blood flow to the kidneys and the so-called splanchnic circulation that includes the liver, stomach, and intestines. Figure below illustrates a typical distribution of cardiac output throughout the body at rest and during heavy exercise. Because cardiac output increases greatly with increasing intensity of exercise, the values are shown both as relative percentages of the total blood available and as absolute flows.
Although several physiological mechanisms are responsible for the redistribution of blood flow through the body during exercise, they work together. To illustrate this, consider what happens to blood flow during exercise, focusing on the primary driver of the response, namely the blood flow requirements of the skeletal muscles.


As exercise begins, the active skeletal muscles rapidly sense the need for increased oxygen delivery. This need is met through sympathetic stimulation of vessels in those areas to which blood flow is to be reduced( e.g. the splanchnic and renal circulations). The resulting vasoconstriction in those areas allows for more of the increasing cardiac output to be redistributed to the exercising skeletal muscles. In the skeletal muscles, sympathetic stimulation to the constrictor fibers in the arteriolar walls also increases; however local vasodilating substances are released from the exercising muscle and overcome sympathetic vasoconstriction, producing an overall vasodilation in the muscle.
Many local vasodilating substances are released in exercising skeletal muscle. As the metabolic rate of the muscle tissue increases during exercise, metabolic waste products begin to accumulate. Increased metabolism causes an increase in acidity(increased hydrogen ions and lower pH), carbon dioxide, and temperature in the muscle tissue. These are some of the local changes that trigger vasodilation of, and increasing blood flow through, the arterioles feeding local capillaries. Local vasodilation is also triggered by the low partial pressure of oxygen in the tissue or a reduction in oxygen bound to hemoglobin(increased oxygen demand), the act of muscle contraction, and possibly other vasoactive substances(including adenosine) released as a result of skeletal muscle contraction.
When exercise is performed in a hot environment, there is an increase in blood flow to the skin to help dissipate the body heat. The sympathetic control of skin blood flow is unique in that there are both typical sympathetic vasoconstrictor fibers(similar to skeletal muscle) and sympathetic active vasodilator fibers interacting. During dynamic exercise, skin blood flow is initially and transiently decreased by an increase in sympathetic vasoconstrictor activity. As body core temperature rises, there is a reduction in this sympathetic vasoconstriction, causing a passive vasodilation. Finally, at a specific body core temperature threshold, skin blood flow begins to dramatically increase through the action of the sympathetic active vasodilator system. The increase in skin blood flow during exercise promotes heat loss, because metabolic heat from deep in the body can be released when blood moves close to the skin. This allows maintenance of the body temperature, although body temperature does increase with exercise.

Cardiovascular drift

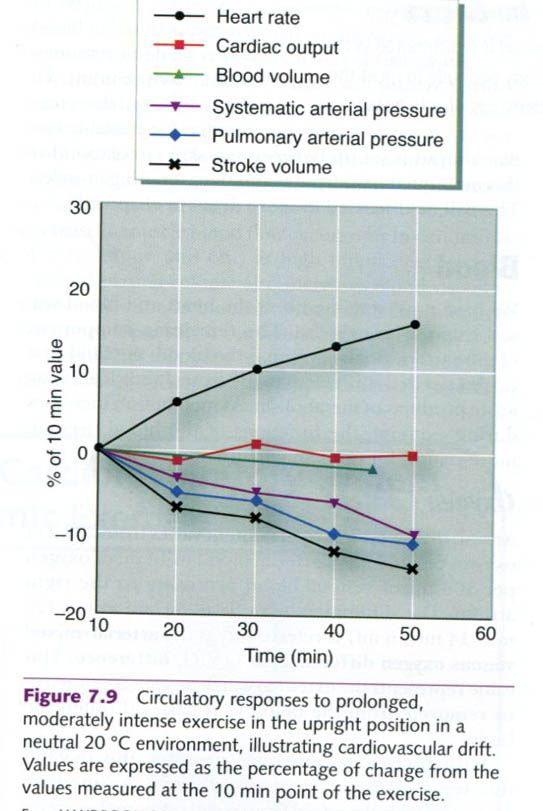
With prolonged aerobic exercise or aerobic exercise in a hot environment, at a constant exercise intensity, SV gradually decreases and HR increases. Cardiac output is well maintained, but arterial blood pressure also declines. These alterations, illustrated in the figure below, have been referred to collectively as cardiovascular drift, and they are generally associated with increasing body temperature. Cardiovascular drift is associated with a progressive increase in the fraction of cardiac output directed to the vasodilated skiin to facilitate heat loss and attenuate the increase in body core temperature. With more blood in the skin for the purpose of cooling the body, less blood is available to return to the heart, thus decreasing preload. There is also a small decrease in blood volume resulting from sweating and from a generalized shift of plasma across the capillary membrane into the surrounding tissues. These factors combine to decrease ventricular filling pressure, which decreases venous return to the heart and reduces the end-diastolic volume. With the reduction in end-diastolic volume, SV is reduced(SV = EDV – ESV). In order to maintain cardiac output(Q = HR x SV). HR increases to compensate for the decrease in SV.


Competition for blood supply

When the demands of exercise are added to blood flow demands for all other systems of the body, competition for a limited available cardiac output can occur. This competition for available blood flow can develop among several vascular beds, depending on the specific conditions. For example, there is a competition for blood flow between active skeletal muscle and the gastrointestinal system following a meal. McKirnan and coworkers studied the effects of feeding versus fasting on the distribution of blood flow during exercise in miniature pigs. The pigs were divided into two groups. One group fasted for 14 to 17h before exercise. The other group ate their morning ration in two feedings: half the ration was fed 90 to 120 minutes before exercise and the other half 30 to 45 minutes before exercise. Both groups of pigs then ran at approximately 65% of their VO2max.
Blood flow to the hindilimb muscles during exercise was 18% lower, and gastrointestinal blood flow was 23% higher, in the fed group than in the fasted group. Similar results in humans suggest that the redistribution of gastrointestinal blood flow to the working muscles is attenuated after a meal. As a practical application, these findings suggest that athletes should be cautious in timing their meals before competition to maximize blood flow to the active muscles during exercise.
Another example of the competition for blood flow is seen in exercise in a hot environment. In this scenario, the competition for available cardiac output is set up between the skin circulation for thermoregulatory purposes and the exercising muscles.


The remaining component is blood: the fluid that carries needed substances to the tissues and clears away waste products of metabolism. As metabolism increases during exercise, the functions of the blood become more critical for optimal performance.

Oxygen content

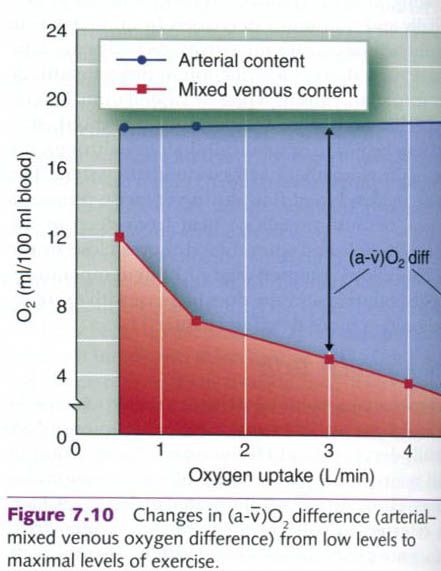
At rest, the blood’s oxygen content varies from 20ml of oxygen per 100ml of arterial blood to 14ml of oxygen per 100ml of venous blood returning to the right atrium. The difference between these two values(20ml – 14ml = 6ml) is referred to as the arterial-mixed venous oxygen difference, or (a-ṽ)O2 difference. This value represents the extent to which oxygen is extracted, or removed, from the blood as it passes through the body.
With increasing exercise intensity, the (a-ṽ)O2 difference increases progressively and can increase approximately threefold from rest to maximal exercise intensities(figure below). This increased difference really reflects a decreasing venous oxygen content, because arterial oxygen content changes little from rest up to maximal exertion. With exercise, more oxygen is required by the active muscles: therefore more oxygen is extracted from the blood. The venous oxygen content decreases, approaching zero in the active muscles. However, mixed venous blood in the right atrium of the heart rarely decreases below 4ml of oxygen per 100ml of blood because the blood returning from the active tissues is mixed with blood from inactive tissues as it returns to the heart. Oxygen use in the inactive tissues is far lower than in the active muscles.


Plasma volume

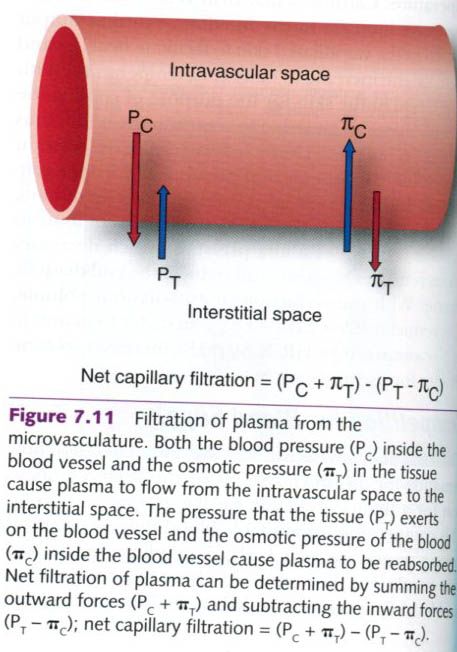
With the onset of exercise, there is an almost immediate loss of plasma from the blood to the interstitial fluid space. The movement of fluid out of the capillaries is dictated by the pressures inside the capillaries, which include the hydrostatic or blood pressure and the osmotic pressure exerted by the proteins in the blood, mostly albumin. The pressures that influence fluid movement outside the capillaries are the pressure provided by the surrounding tissue as well as the osmotic pressures from proteins in the interstitial fluid(figure below). As blood pressure increases with exercise, the hydrostatic pressure within the capillaries also increases. Thus, the increase in blood pressure forces water from the vascular compartment to the interstitial compartment. Also, as metabolic waste products build up in the active muscle, intramuscular osmotic pressure increases, which draws fluid out of the capillaries to the muscle. 


Approximately a 10% to 15% reduction in plasma volume can occur with prolonged exercise. Similarly, 15% to 20% decreases in plasma volume have been observed in 1 min bouts of exhaustive exercise. With resistance training, the plasma volume loss is proportional to the intensity of the effort, with losses of from 10% to 15%.
If exercise intensity or environmental conditions cause sweating, additional plasma volume losses may occur. Although the major source of fluid for sweating is the interstitial fluid, this fluid space will be diminished as sweating continues. This increases the osmotic pressure in the interstitial space(since proteins do not move with the fluid), causing even more plasma to move out of the vascular compartment into the interstitial space. Intracellular fluid volume is impossible to measure directly and accurately, but research suggests that fluid is also lost from the intracellular compartment and even from the red blood cells, which may shrink the size.
A reduction of plasma volume will impair performance under many circumstances. For long-duration activities in which dehydration occurs and heat loss is a problem, the total flow of blood to active tissues must be reduced to allow increasingly more blood to be diverted to the skin in an attempt to lose body heat. Note that a decrease in muscle blood flow occurs only in conditions of dehydration and only at high intensities. Severely reduced plasma volume also increases blood viscosity, which can impede blood flow and thus limit oxygen transport, especially if the hematocrit exceeds 60%.
In activities that last a few minutes or less, body fluid shifts are of little practical importance. As exercise duration increases, however, body fluid changes and temperature regulation become important for performance. For the football player, the Tour de France cyclist, or the marathon runner, these processes are crucial, not only for competition but also for survival. Deaths have occurred from dehydration and hyperthermia during or as a result of various sport activities.

Hemoconcentration

When plasma volume is reduced, hemoconcentration occurs: the fluid portion of the blood is reduced, and the cellular and protein portions represent a larger fraction of the total blood volume. That is, they become more concentrated in the blood. This hemoconcentration increases red blood cell concentration substantially – by up to 20% or 25%. Hematocrit can increase from 40% to 50%. However, the total number and volume of red blood cells do not change substantially.
The net effect, even without an increase in the total number of red blood cells, is to increase the number of red blood cells per unit of blood; that is, the cells are more concentrated. As the red blood cell concentration increases, so does the blood’s per unit hemoglobin content. This substantially increases the blood’s oxygen-carrying capacity, which is advantageous during exercise and provides a distinct advantage at altitude at rest and during submaximal exercise.

Integration of the exercise response

As is evident from all of the changes in cardiovascular function that take place at the onset of exercise, the cardiovascular system is extremely complex but responds exquisitely to deliver oxygen to meet the demands of exercising muscle. Figure below is a simplified flow diagram that illustrates how the body integrates all these cardiovascular responses to provide for its needs during exercise. Key areas and responses are labeled and summarized to help illustrate how these complex control mechanisms are coordinated. It is important to note that although the body attempts to meet the blood flow needs of the muscle, it can do so only if blood pressure is not compromised. Maintenance of arterial blood pressure appears to be the highest priority of the cardiovascular system, irrespective of exercise, the environment, and other competing needs.


1)      Cardiovascular function is regulated by the medulla in the brain.
2)      Medulla regulates heart rate via the pacemaker in the right atrium.
3)      Right atrium is stimulated by sympathetic and parasympathetic nerves to raise and lower heart rate.
4)      The motor cortex of the brain stimulates the medulla in proportion to the amount of muscle recruited.
5)      Sensory nerves in the muscle send impulses to the medulla regarding the metabolic status of the muscle.
6)      High-pressure baroreceptors in the arteries send impulses to the medulla regarding arterial blood pressure.
7)      With increases in exercise intensity, sympathetic nerves cause reduction of blood flow to the stomach, liver, and intestines…
8)      … and the kidneys…
9)      … and the skin(unless there is a need for heat dissipation).
10)  Release of metabolites from exercising skeletal muscles causes vasodilation of the arterioles leading to the active fibers.
11)  However, muscle can accept too much blood flow; thus sympathetic nerves to exercising muscles must increase resistance somewhat to maintain blood pressure.
12)  Low-pressure baroreceptors in the right side of the heart and pulmonary circulation detect the extent to which the heart is filling with blood. With increased filling, the low-pressure baroreceptors send impulses to the brain to lower resistance to exercising skeletal muscles(11); thus, arterial pressure is maintained.


Cardiovascular responses to acute exercise - part II


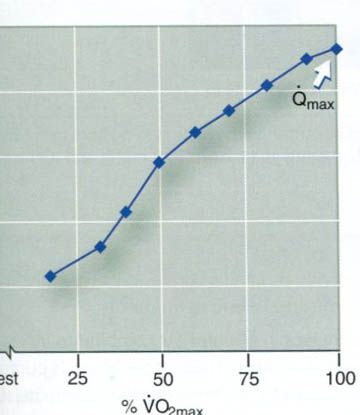
If we recall that cardiac output is the product of heart rate and stroke volume(Q = HR x SV), cardiac output predictably increases with increasing exercise intensity(figure below). Resting cardiac output is approximately 5.0 L/min, but varies in proportion to the size of the person. Maximal cardiac output varies between 20(sedentary person) and 40(elite endurance athlete) L/min and is a function of both body size and endurance training. The linear relationship between cardiac output and intensity of exercise is predictable because the major purpose of the increase in cardiac output is to meet the muscles’ increased demand for oxygen. Like VO2max, when cardiac output approaches maximal exercise intensities it may reach a plateau. In fact, it is likely that VO2max is limited by this leveling off of cardiac output.


The integrated cardiac response to exercise

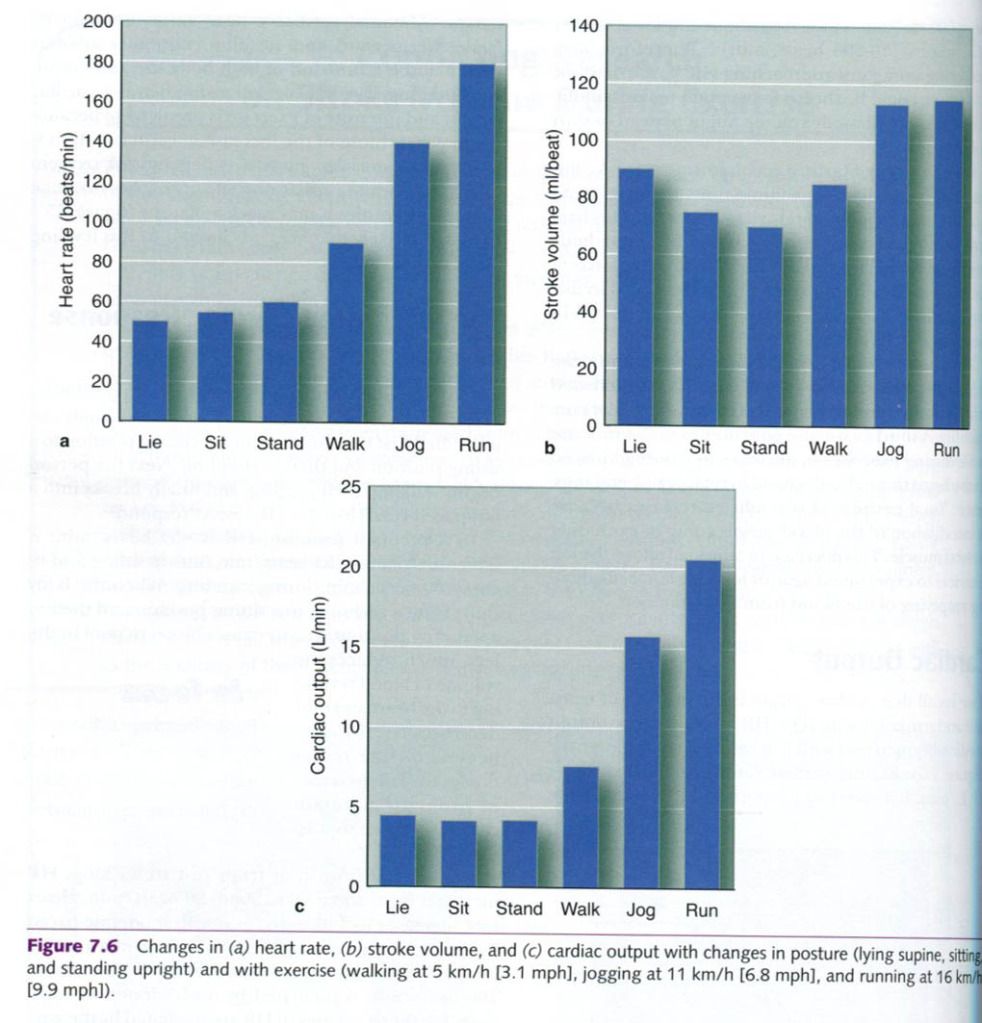
To see how HR, SV, and Q vary under various conditions of rest and exercise, consider the following example. An individual first transitions from a reclining position to a sitting position and then to standing. Next the person begins walking, then jogging, and finally breaks into a fast-paced run. How does the heart respond?
In a reclined position, HR is ~50 beats/min; it increases to about 55 beats/min during sitting and to about 60 beats/min during standing. When the body shifts from a reclining to a sitting position and then to a standing position, gravity causes blood to pool in the legs, which reduces the volume of blood returning to the heart and thus decreases SV. To compensate for the reduction in SV, HR increases in order to maintain cardiac output; that is, Q = HR x SV.
During the transition from rest to walking, HR increases from about 60 to about 90 beats/min. Heart rate increases to 140 beats/min with moderate-paced jogging and can reach 180 beats/min or more with a fast-paced run. The initial increase in HR up to about 100 beats/min is mediated by a withdrawal of vagal tone. Further increases in HR are mediated by th sympathetic nervous system. Stroke volume also increases with exercise, further increasing cardiac output. These relationships are shown in the picture below.


During the initial stages of exercise in untrained individuals, increased cardiac output is caused by an increase in both HR and SV. When the level of exercise exceeds 40% to 60% of the individual’s maximal exercise capacity. SV either plateaus or continues to increase, but at a much slower rate. Thus, further increases in cardiac output are largely the result of increases in HR. Stroke volume increases are likely to contribute more to the rise in cardiac output during the higher intensities of exercise in those people who are highly trained.

Blood pressure

During dynamic exercise, mean arterial blood pressure increases substantially. However, systolic and diastolic blood pressure do not increase to a similar degree. With whole-body endurance exercise, systolic blood pressure increases in direct proportion to the increase in exercise intensity. However, diastolic pressure does not change significantly, and may even decrease. A systolic pressure that starts out at 120mmHg in a normal healthy person at rest can exceed 200mmHg at maximal exercise. Systolic pressures of 240 to 250mmHg have been reported in normal, healthy, highly trained athletes at maximal intensities of aerobic exercise.
Increased systolic blood pressure results from the increased cardiac output(Q) that accompanies increasing rates of work. This increase in pressure helps facilitate the increase in blood flow through the vasculature. Also, blood pressure(that is, hydrostatic pressure) determines how much plasma leaves the capillaries, entering the tissues and carrying needed supplies. Thus increased systolic pressure aids substrate delivery to working muscles.
Blood pressure reaches a steady state during submaximal steady-state endurance exercise. As work intensity increases, so does systolic blood pressure. If steady-state exercise is prolonged, the systolic pressure might start to decrease gradually, but diastolic pressure remains constant. The slight decrease in systolic blood pressure, if it occurs, is a normal response and simply reflects increased arteriole dilation in the active muscles, which decreases the total peripheral resistance or TPR(since blood pressure = cardiac output x total peripheral resistance).
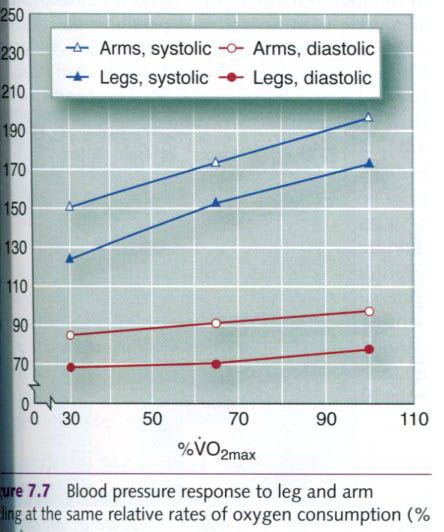
Diastolic blood pressure changes little during submaximal dynamic exercise; however, at maximal exercise intensities, diastolic blood pressure increases slightly. Remember that diastolic pressure reflects the pressure in the arteries when the heart is at rest(diastole). With dynamic exercise there is an overall increase in sympathetic neural tone to the vasculature, causing overall vasoconstriction. However, this vasoconstriction is blunted in the exercising muscles by the release of local vasodilators. Thus, there is a balance between vasoconstriction to inactive regions and vasodilatation in the active skeletal muscle; therefore diastolic pressure does not change substantially. However, in some cases of cardiovascular disease, increases in diastolic pressure of 15mmHg or more occur in response to exercise and are one of several indications for immediately stopping a diagnostic exercise test. Figure below illustrates a typical blood pressure response to leg and arm cycling exercise with increasing exercise intensities.


As seen in figure, upper body exercise causes a greater blood pressure response than leg exercise at the same absolute rate of energy expenditure. This is most likely attributable to the smaller muscle mass and vasculature of the upper body compared with the lower body, plus an increased energy demand to stabilize the body during arm exercise. This difference in the systolic blood pressure response to upper and lower body exercise has important implications for the heart. Myocardial oxygen uptake and myocardial blood flow are directly related to the product of HR and systolic blood pressure. This value is referred to as the rate-pressure product or double product(DP = HR x SBP). With static or dynamic resistance exercise or upper body work, the rate-pressure product is elevated , indicating increased myocardial oxygen demand. This relationship between rate-pressure product and myocardial oxygen demand is important in clinical exercise testing.
Blood pressure responses to resistance exercise, such as weighlifting, are exaggerated. With high-intensity resistance training, blood pressure can reach 480/350mmHg. In such exercise, use of the Valsalva maneuver is quite common. This maneuver occurs when a person tries to exhale while the mouth, nose, and glottis are closed. This action causes an enormous increase in intrathoracic pressure. Much of subsequent blood pressure increase results from the body’s effort to overcome the high internal pressures created during the Valsalva maneuver.  

25. 6. 2012.

Cardiovascular responses to acute exercise - part I

Numerous cardiovascular changes occur during dynamic exercise. All share a common goal: to meet the increased demands necessary to perform exercise. To better understand the changes that occur, we must look more closely at specific cardiovascular functions. Following changes will be examined here in the cardiovascular system:
  • Heart rate
  • Stroke volume
  • Cardiac output
  • Blood pressure
  • Blood flow
  • Blood.


Heart rate(HR) is one of the simplest and yet most informative of the cardiovascular parameters. Measuring HR involves simply taking the subject’s pulse, usually at the radial or carotid artery. Heart rate is a good indicator of the intensity of exercise.

Resting heart rate

Resting heart rate(RHR) averages 60 to 80 beats/min in most individuals. In highly conditioned, endurance-trained athletes, resting rates as low as 28 to 40 beats/min have been reported. This is mainly due to an increase in vagal tone that accompanies endurance exercise training. Resting heart rate can also be affected by environmental factors, for example, it increases with extremes in temperature and altitude.
Just before the start of exercise, preexercise HR usually increases above normal resting values. This is called an anticipatory response. This response is mediated through release of the neurotransmitter norepinephrine from the sympathetic nervous system and the hormone epinephrine from the adrenal medulla. Vagal tone probably also decreases. Because preexercise HR is elevated, reliable estimates of the true RHR should be made only under conditions of total relaxation, such as early in the morning before the subject rises from a restful night’s sleep.

Heart rate during exercise

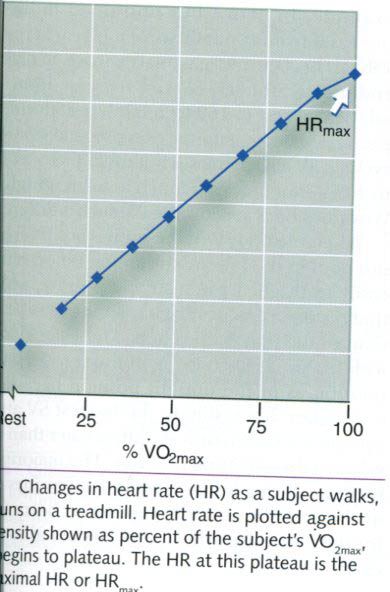
When exercise begins, HR increases directly in proportion to the increase in exercise intensity(see picture below), until near-maximal exercise is achieved. As maximal exercise intensity is approached, HR begins to plateau even as the exercise workload continues to increase. This indicates that HR is approaching a maximum value. The maximum heart rate(HRmax) is the highest HR value achieved in an all-out  effort to the point of exhaustion. This is a highly reliable value that remains constant from day to day. However, this value changes slightly from year to year due to the normal age-related decline in HRmax.


HRmax is often estimated based on age because HRmax shows a slight but steady decrease of about one beat per year beginning at 10 to 15 years of age. Subtracting one’s age from 220 provides an approximation of one’s average HRmax. However, this is only an estimate – individual values vary considerably from this average value. To illustrate, for a 40-year-old person, HRmax would be estimated to be 180 beats/min(HRmax = 220-40). However, 68% of all 40-year-olds have actual HRmax values between 168 and 192 beats/min(mean ±1 standard deviation), and 95% fall between 156 and 204 beats/min(mean ±2 standard deviations). This demonstrates the potential for error in estimating a person’s HRmax. A more accurate equation has been developed to estimate HRmax from age. In this equation, HRmax = 208 – (0.7 x age).
When the rate of work is held constant at a submaximal intensity, HR increases fairly rapidly until it reaches a plateau. This plateau is the steady-state heart rate, and it is optimal HR for meeting the circulatory demands at that specific rate of work. For each subsequent increase in intensity, HR will reach a new steady-state value within 2 to 3 min. However, the more intense the exercise, the longer it takes to achieve this steady-state value.
The concept of steady-state heart rate forms the basis for several tests that have been developed to estimate physical fitness. In one such test, individuals are placed on an exercise device, such as a cycle ergometer, and then perform exercise at two or three standardized exercise intensities. Those in better physical condition(i.e., those with better cardiorespiratory endurance capacity) will have a lower steady-state HR at each exercise intensity than those who are less fit. Thus, steady-state HR is a valid predictor of cardiorespiratory fitness: A lower steady-state HR reflects greater cardiorespiratory fitness.
Figure below illustrates results from a submaximal exercise test performed by two different individuals of the same age. Steady-state HR is measured at three to four distinct workloads, and a line of best fit is drawn through the data points. Because there is a consistent relationship between intensity and energy demand, steady-state HR can be plotted versus the corresponding energy(VO2) required to do work on the cycle ergometer. The resultant line can be extrapolated to the age-predicted HRmax to estimate an individual’s maximal exercise capacity. In this picture, subject A has a higher fitness level than subject B because at any given submaximal intensity, his HR is lower; and extrapolation to age-predicted HRmax yields a higher estimated maximal exercise capacity(VO2max).


Stroke volume(SV) also changes during acute exercise to allow the heart to meet the demands of exercise. At near-maximal and maximal exercise intensities, SV is a major determinant of cardiorespiratory endurance capacity.
Stroke volume is determined by four factors:
1)      The volume of venous blood returned to the heart(the heart can only pump what returns: preload)
2)      Ventricular distensibility(the capacity to enlarge the ventricle, for maximal filling)
3)      Ventricular contractility(the inherent capacity of the ventricle to contract)
4)      Aortic or pulmonary artery pressure(the pressure against which the ventricles must contract: afterload).

The first two factors influence the filling capacity of the ventricle, determining how much blood is available for filling the ventricle and the ease with which the ventricle is filled at the available pressure. This is reffered to preload. The last two factors influence the ventricle’s ability to empty, determining the force with which blood is ejected and the pressure, or afterload, against which it must be expelled into the arteries. These four factors directly control the alterations in SV in response to increasing exercise intensity.

Stroke volume increase with exercise

Stroke volume increases above resting values during exercise. Most researchers agree that SV increases with increasing rates of work, but only up to exercise intensities somewhere between 40% and 60% of maximal capacity. At that point, SV typically plateaus, remaining essentially unchanged up to and including the point of exhaustion in the picture below. However, other researchers have reported that SV continues to increase up through maximal exercise intensities. 


When the body is in an upright position, SV can almost double from resting to maximal values. For example, in active but untrained individuals, SV increases from about 60 to 70 ml/beat at rest to 110 to 130ml/beat during maximal exercise. In highly trained endurance athletes, SV can increase from 80 to 110ml/beat at rest to 160 to 200ml/beat during maximal exercise. During supine exercise, such as recumbent cycling, SV also increases but usually by only about 20% to 40% - not nearly as much as in an upright position. Why does body position make such a difference?
When the body is in the supine position, blood does not pool in the lower extremities. Blood returns more easily to the heart in a supine posture, which means that resting SV values are higher in the supine position than in the upright position. Thus, the increase in SV maximal exercise is not as great in the supine position than in the upright position. Thus, the increase in SV with maximal exercise is not as great in the supine position as in the upright position because SV starts out higher. Interestingly, the highest SV attainable in upright exercise is only slightly greater than the resting value in the reclining position. The majority of the SV increase during low to moderate intensities of exercise in the upright position appears to be compensating for the force of gravity that causes blood to pool in the extremities.

Explanations for the stroke volume increase

One explanation for the increase in SV with exercise is that the primary factor determining SV is increased preload or the extent to which the ventricle fills with blood and stretches. When the ventricle stretches more during filling, it subsequently contracts more forcefully. For example, when a larger volume of blood enters and fills the ventricle during diastole, the ventricular walls stretch. To eject that greater volume of blood, the ventricle responds by contracting more forcefully. This is reffered to Frank-Starling mechanism. Additionally, SV can increase during exercise if the ventricle’s contractility is enhanced by an increase in neural stimulation, an increased release of circulating catecholamines(epinephrine, norepinephrine), or both, even without an increased end-diastolic volume. These mechanisms combine to increase SV during dynamic exercise.
Some clinically used cardiovascular diagnostic techniques have made it possible to determine exactly how SV changes with exercise. Echocardiography(using sound waves) and radionuclide techniques(“tagging” of red blood cells with radioactive tracers) have elucidated how the heart chambers respond to increasing oxygen demands during exercise. With either technique, continuous pictures can be taken of the heart at rest and up to near-maximal intensities of exercise.
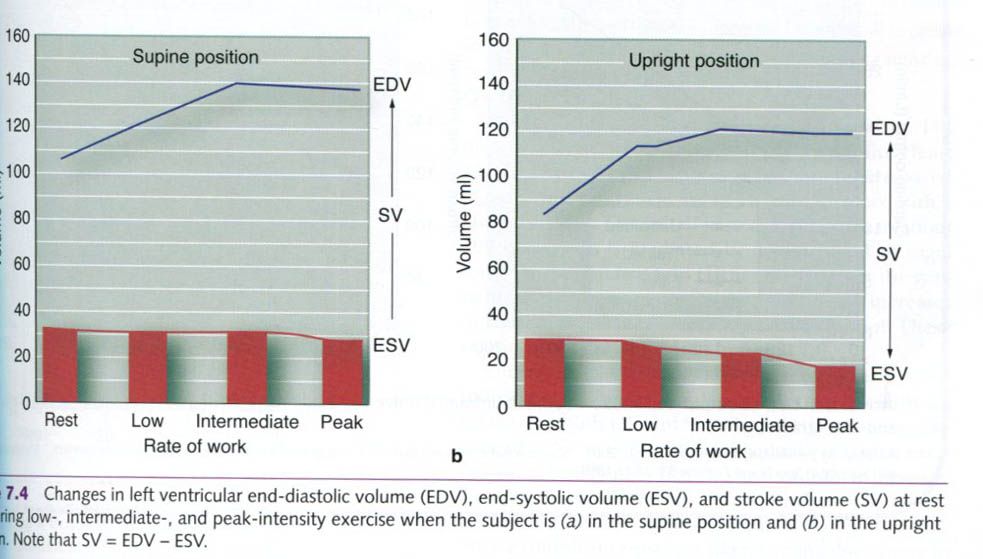
Figure below illustrates the results of one study of normally active but untrained subjects. In this study, participants were tested during both supine and upright cycle ergometry under four conditions, which are depicted on the x-axis:
  • Rest
  • Low-intensity exercise
  • Intermediate-intensity exercise
  • Peak-intensity exercise.


Going from resting conditions to exercise of increasing intensities, there is an increase in left ventricular end-diastolic volume(a greater filling or preload), indicating that the Frank-Starling mechanism is operating. There is also a decrease in the left ventricular end-systolic volume(greater emptying), indicating an increased degree of contractility.
This figure shows that both the Frank-Starling mechanism and increased contractility are important in increasing SV during exercise. The Frank-Starling mechanism appears to have its greatest influence at lower exercise intensities, and contractility has its greates effects at higher exercise intensities.
Recall that HR also increases with exercise intensity. The plateau or small decrease in left ventricular end-diastolic volume at higher exercise intensities could be caused by reduced ventricular filling time. One study showed that ventricular filling time decreased from about 500 to 700ms at rest to about 150ms at higher HRs(about 150-200 beats/min). Therefore, with increasing work rates approaching HRmax, the diastolic filling time could be shortened enough to limit filling. As a result, end-diastolic volume might plateau or start to decrease.
For the Frank-Starling mechanism to work, left ventricular end-diastolic volume must increase by an increase in venous blood return to the heart. This happens through redistribution of blood by sympathetic through redistribution of blood by sympathetic activation of arteries and arterioles in inactive areas of the body such as in the renal and splanchnic circulations. Also, the muscle and respiratory pumps aid in increasing venous return.
Thus, two factors that can contribute to an increase in SV with increasing intensity of exercise are increased venous return(preload) and increased ventricular contractility. A third factor also contributes to the increase in SV during exercise -  a decrease in afterload placed on the heart through a decrease in total peripheral resistance. Total peripheral resistance decreases because of vasodilatation of the blood vessels going to exercising skeletal muscle. This decrease in afterload allows the left ventricle to expel blood against less resistance, facilitating emptying of the blood from this chamber.


Search this blog